The Setup#
The cluster has three GPU nodes:
- 2x DGX Spark — NVIDIA GB10 (Grace Blackwell SoC, ARM64, 128 GB unified memory)
- 1x Ryzen 9 workstation — NVIDIA GeForce RTX 5070 Ti (16 GB VRAM)
I wanted a single Grafana dashboard that shows all three GPUs side by side, with clear labels for which hardware is which.
DCGM Exporter#
DCGM (Data Center GPU Manager) is NVIDIA’s tool for GPU telemetry. The dcgm-exporter Helm chart runs as a DaemonSet, exposing Prometheus-format metrics from every GPU node.
The key metrics it exposes:
DCGM_FI_DEV_GPU_TEMP— GPU temperatureDCGM_FI_DEV_POWER_USAGE— power draw in wattsDCGM_FI_DEV_GPU_UTIL— GPU compute utilizationDCGM_FI_DEV_SM_CLOCK— SM clock frequencyDCGM_FI_DEV_FB_USED— framebuffer memory usedDCGM_FI_PROF_PIPE_TENSOR_ACTIVE— tensor core utilization
One nice thing about DCGM: every metric includes a modelName label, so you get NVIDIA GeForce RTX 5070 Ti or NVIDIA GB10 right in the time series data. No manual mapping needed.
Scraping with VictoriaMetrics#
The cluster runs VictoriaMetrics (via the victoria-metrics-k8s-stack Helm chart) instead of Prometheus. Rather than using Prometheus ServiceMonitor CRDs (which don’t exist in this stack), I created a VMPodScrape:
apiVersion: operator.victoriametrics.com/v1beta1
kind: VMPodScrape
metadata:
  name: dcgm-exporter
  namespace: dcgm-exporter
spec:
  podMetricsEndpoints:
    - port: metrics
      path: /metrics
      relabelConfigs:
        - sourceLabels: [__meta_kubernetes_pod_node_name]
          targetLabel: instance
      metricRelabelConfigs:
        - action: labeldrop
          regex: exported_pod|exported_container|exported_namespace|pod|container|endpoint|prometheus
  selector:
    matchLabels:
      app.kubernetes.io/name: dcgm-exporter
Two important details here:
Node name as instance label. By default, the instance label is the pod IP + port (10.244.0.136:9400), which is meaningless. Relabeling it to __meta_kubernetes_pod_node_name gives you talos-76w-3r0 instead.
Dropping high-cardinality labels. DCGM reports which pod is using the GPU via exported_pod / exported_container labels. Every time a workload starts or stops, that creates a brand new time series. Combined with DaemonSet rollovers changing the pod label, you end up with an explosion of stale series. Dropping these labels keeps cardinality under control.
The Dashboard#
I started from Grafana dashboard 12239 and customized it heavily.
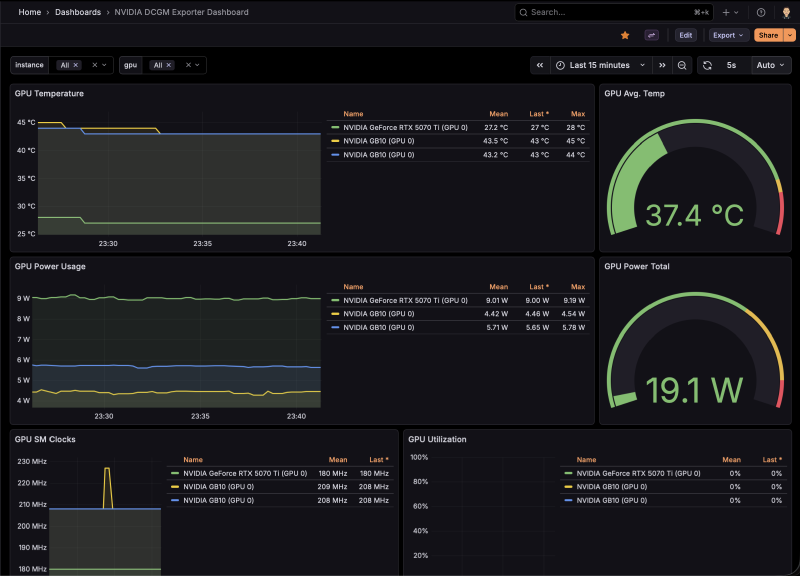
Changes from the stock dashboard:
- Instance variable queries
Hostnamelabel instead ofinstance - All queries filter on
Hostnameand includeinstance!~".*:.*"to exclude stale IP-based series - Legend format uses
{{modelName}} (GPU {{gpu}})instead of justGPU {{gpu}} - 2-column layout for the bottom panels (SM Clocks + Utilization, Tensor Cores + Framebuffer)
- GPU Power Total gauge rescaled from 2400W (data center scale) to 600W (homelab scale), with
lastNotNullcalc instead ofsum - All dropdowns default to “All” selected
Note: the DGX Sparks don’t report DCGM_FI_PROF_PIPE_TENSOR_ACTIVE or DCGM_FI_DEV_FB_USED — the GB10’s unified memory architecture doesn’t support these counters.
Provisioning via GitOps#
The dashboard is provisioned as a Kubernetes ConfigMap with the grafana_dashboard: "1" label. Grafana’s sidecar container watches for ConfigMaps with this label and automatically loads them.
This approach avoids a known issue with the victoria-metrics-k8s-stack chart, which doesn’t allow grafana.sidecar.dashboards.enabled and grafana.dashboards to be set at the same time. By using a standalone ConfigMap instead of the chart’s built-in dashboard provisioning, the sidecar stays enabled and everything works.
The full dashboard JSON, VMPodScrape, and HelmRelease are all managed via FluxCD — no manual kubectl apply needed (well, after the initial debugging).